Amazon - Redesigning the Internal Data Collection Tool
Internal Data Tool Development | Generative Research
Project Overview
My Role: UX Researcher (with Product & Design Ownership)
Timeline: August 2021 - February 2022
Team: UX Designer, Engineer, TPMs (Seattle & San Jose)
Research Method: Concept testing, In-depth interviews (IDIs), and post prototype surveys.
My role:
As the sole UX Researcher on this project, I took ownership of both the research direction and early product thinking. I collaborated cross functionally with the UX Designer, Engineers, and TPMs to drive the redesign from field discovery to usability validation.
My responsibilities included:
Planning and executing end-to-end research (discovery → testing → validation)
Leading field visits and direct observation at testing sites
Conducting interviews and running 2 rounds of usability testing
Collaborating on wireframes, iterating designs based on feedback
Delivering insights and benchmarks to inform product readiness and rollout strategy
This was a high ownership role that blended UX research, product insight, and rapid iteration under tight deadlines.
Due to the nature of Amazon's non-disclosure agreement, I cannot share through image details about my research process on my website. More specific information on my images, visuals, and designs for Amazon can be shared privately in a portfolio presentation upon request by emailing me.
Project Journey & Impact Overview
Reduction in data collection enrollment and setup time
Fewer clicks
Satisfaction rate
Goal
Redesign Amazon’s internal ML Data Collection Tool to reduce the time and friction involved in onboarding participants and collecting video data, improving both usability for data collectors and operational efficiency for the ML model team.
Let's Dive Deeper!
The Problem Statement
The legacy tool used to onboard participants and collect ML training data was error prone, slow, and poorly designed.
Enrollment took over 90 minutes
Users couldn’t find basic setup options or measurements
UI required zooming and manual guessing
Equipment setup was physically intensive and inconsistent
One TPM said:
“This tool is actually s***. Someone please help rebuild it.”
And the Director of Ops warned:
“We are definitely not going to meet the June deadline. We are in deep trouble.”
The experience wasn't just frustrating, it was threatening operational goals. We had 6 months to fix it.
Research Process
Before jumping into research, I aligned with the TPM and engineers to fully understand how the current ML Data Collection Tool was being used across different environments. I quickly realized this wasn’t just a software issue, it was an operational bottleneck. Equipment setup was inconsistent, enrollment steps were unclear, and the UI wasn’t responsive across devices. There was also growing pressure to hit tight deadlines, which meant we needed research to surface critical usability issues fast, prioritize fixes, and validate improvements before rollout.
Discovery: Field Study & Site Observations
After aligning with our TPM and engineers, I needed firsthand insight into how the ML Data Collection Tool performed in the field. I prioritized in-person observation to understand environmental friction and UI struggles that remote testing might miss.
Method: Field Study & Observational Research
Why this method: To capture in context usage, environmental barriers, and unspoken frustrations across different data collection setups.
Participants: Data collectors at indoor and outdoor test sites
What happened:
I traveled to observe the tool in action: unpacking gear, onboarding participants, and navigating setup flows
Documented pain points like squinting, repetitive zooming, lack of clear next steps
Key Findings:
Small font size and touch targets caused interaction delays
UI lacked hierarchy, labels, and guided navigation
Setup ergonomics varied greatly and introduced safety risks
Transition:
• These insights revealed critical UI and physical design problems
• I transitioned into contextual interviews to better understand mental models and workflow logic.
In Depth Interviews (IDIs)
After witnessing usability and ergonomic issues firsthand, I needed to dive deeper into users' cognitive load, why they struggled with navigation, measurement input, and task confidence.
Method: Contextual 1:1 Interviews
Why this method & goal:
To gather qualitative insights on task confusion, expectation mismatches, and pain points that weren’t always visible during live sessions (during data collection).
Who was involved:
• 6 Data Collection Researchers
• Insights shared with UX designer and TPM
Process:
• Conducted remote interviews covering enrollment, measurement, and completion workflows
• Used task walkthroughs to pinpoint friction and get quotes in users’ own words
What came out of it:
• Drop downs had over 100 items with no search functionality
• Users couldn’t tell how to begin setup or validate successful entry
• Metric vs. imperial confusion created delays
Transition:
Interviews revealed a clear need for simplified flows, scalable interaction models, and visual hierarchy. I collaborated with the designer and engineers to develop low fidelity prototypes for fast iteration.
Low Fidelity Prototyping
With pain points validated and design priorities defined, I partnered with our UX Designer to start building and iterating on solutions that could meet field needs while staying within development constraints.
Method: Collaborative Wireframing + MVP Scoping
Why this method & goal:
To prototype ideas quickly and test layout, hierarchy, and functionality logic before investing engineering effort.
Who was involved:
• UX Designer, TPM, and engineers
• I led synthesis and structured collaborative creative sessions
Process:
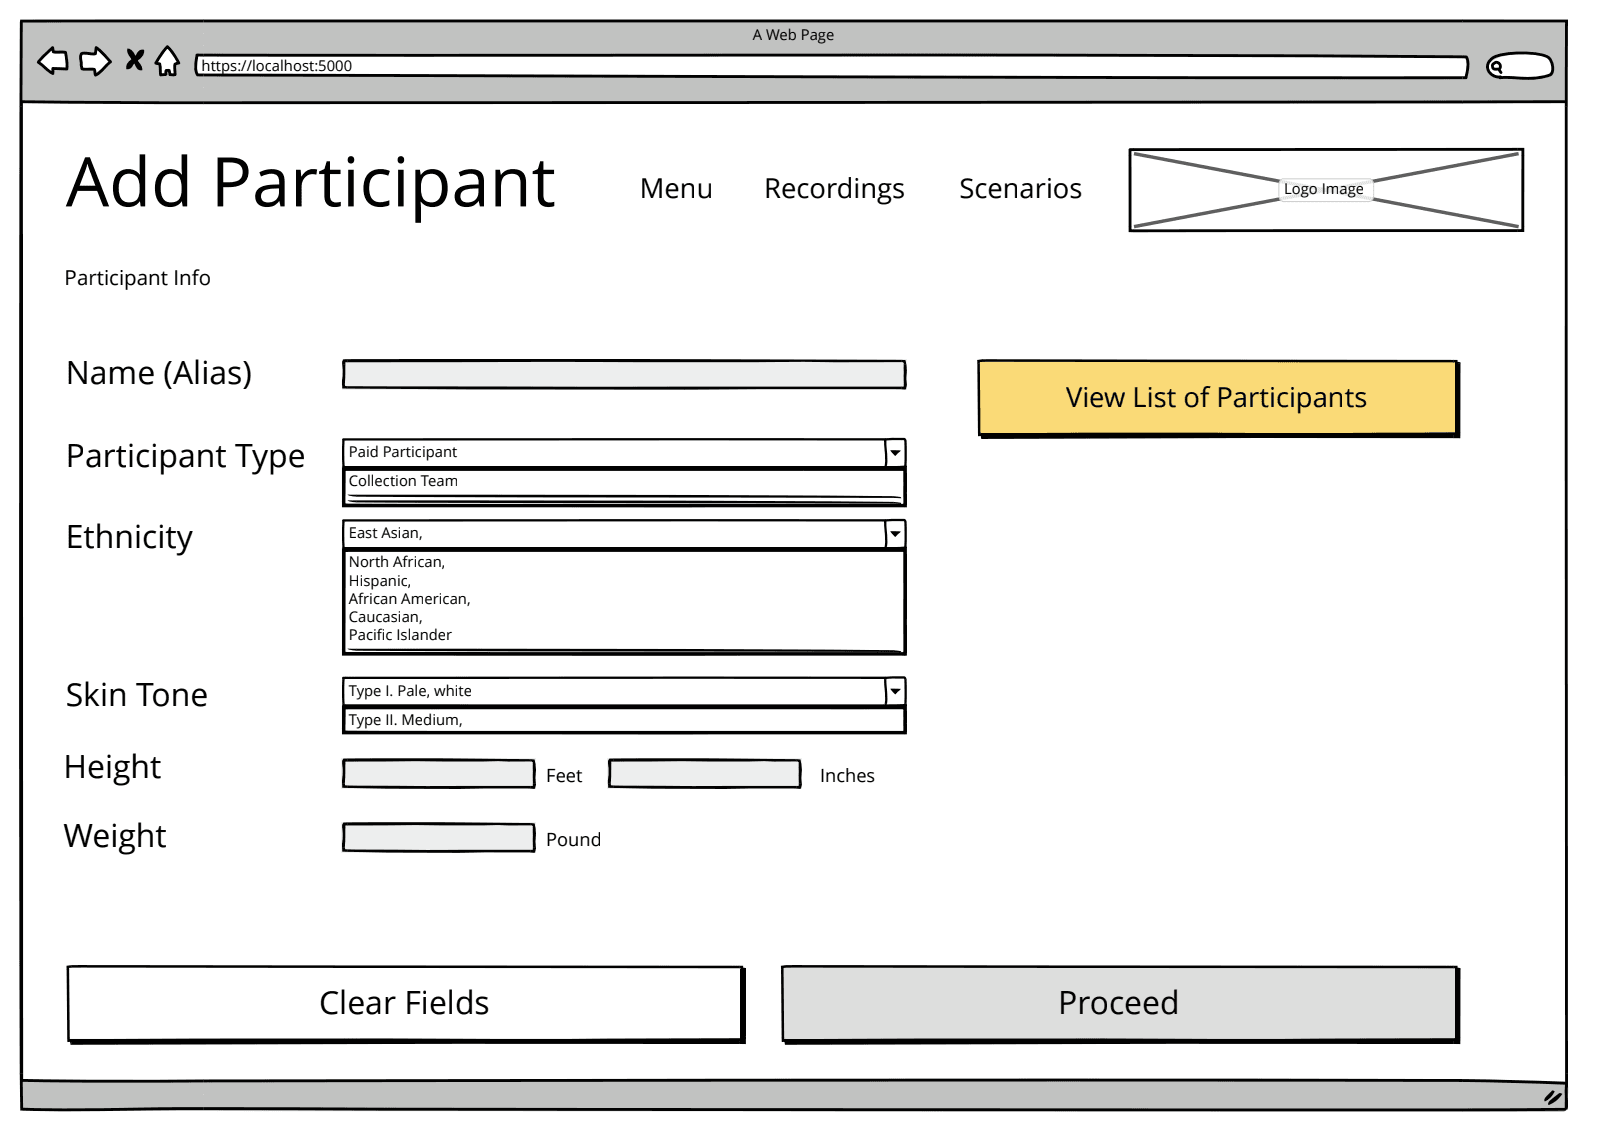
• Created wireframes that added search, reduced visual noise, and clarified navigation
• Proposed collapsible UI, dark mode, and safer measurement prompts
• Prioritized MVP features based on feasibility and user urgency
What came out of it:
• Clear MVP scope for engineering
• Visual hierarchy and flows mapped to user needs
• Early alignment across product, design, and dev
Transition:
With low-fi wireframes in hand, we needed to validate them through usability testing to ensure real users could complete core workflows with ease.
Usability Testing (2 Rounds)
To validate wireframe direction and identify existing UX friction, I conducted two iterative rounds of usability testing with real users.
Method: Moderated Usability Testing
Why this method & goal:
To measure clarity, task completion, and user confidence while gathering confusion and reaction data.
Who was involved:
• 12 returning users from field sites
• I coordinated logistics, sessions, and synthesis
Process:
• Asked participants to complete full setup flow using new wireframes
• Used think aloud protocols and click tracking
• Iterated between rounds to resolve drop off points and ambiguities
What came out of it:
• Search bar significantly improved dropdown navigation
• Collapsible layout reduced scrolling and cognitive overload
• 95% said the process felt “easier” or “much easier” than before
Transition:
With validated flows and confidence in design performance, I launched benchmark testing and a post survey to quantify gains and secure stakeholder buy in.
Benchmark & Satisfaction Survey
Final testing confirmed usability improvements, but I needed hard numbers to justify rollout and measure success at scale.
Method: Benchmark Comparison + Post-Use Survey
Why this method & goal:
To quantify improvements in setup time, navigation effort, and satisfaction over the legacy tool.
Who was involved:
• 30 data collectors from across teams
• PM and TPM used results to inform rollout
Process:
• Timed task benchmarks across legacy vs. redesigned flows
• Collected survey data on ease, satisfaction, and confidence
What came out of it:
• Setup time reduced by 30% (90 → 40 minutes)
• Navigation clicks reduced by 25%
• 95% user satisfaction with the new tool
Transition:
These results were presented to the PM and engineering team to finalize launch priorities and inform future design ops at scale.
Overall Reflection
My POV
This was one of the most intense and rewarding projects I’ve worked on. With only 6 months, I had to move quickly, scope carefully, and prioritize what mattered most: clarity, communication, and operational usability.
Field research grounded me in real user pain, while close collaboration with TPMs and engineers helped ensure we scoped features that made sense. When a data collector said, “I’m still not sure where to start,” it reminded me that great design is about building trust, especially under pressure.
If I had more time, I would’ve:
Run longitudinal studies to track tool adoption
Explored data quality impact from better UX
Included accessibility testing for vision and physical strain
This project sharpened my ability to lead research under tight deadlines, collaborate across disciplines, and bring a product mindset to usability at scale.